38C3: Xobs on Hardware Debuggers

If you just want to use a debugger for your microcontroller project, you buy some hardware device, download the relevant driver software, and fire up GDB. But if you want to make a hardware debugger yourself, you need to understand the various target chips’ debugging protocols, and then you’re deep in the weeds. But never fear, Sean [Xobs] Cross has been working on a hardware debugger and is here to share his learnings about the ARM, RISC-V, and JTAG debugging protocols with us.
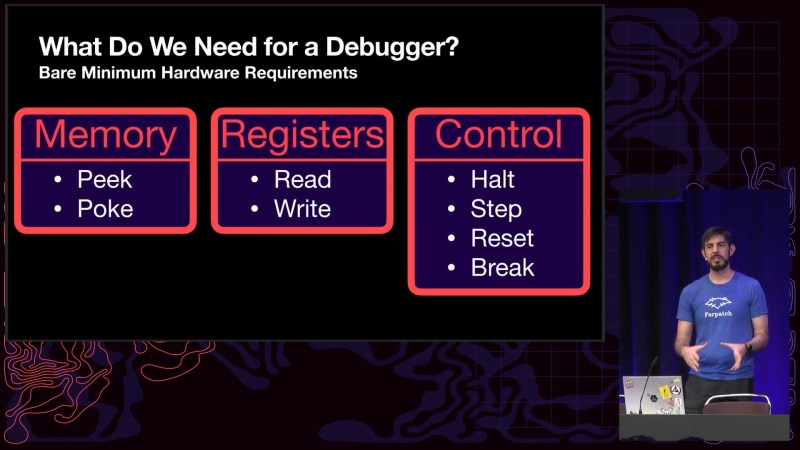
He starts off with a list of everything you need the debugger hardware to be able to do: peek and poke memory, read and write to the CPU registers, and control the CPU’s execution state. With that simple list of goals, he then goes through how to do it for each of the target chip families. We especially liked [Xobs]’s treatment of the JTAG state machine, which looks pretty complicated on paper, but in the end, you only need to get it in and out of the shift-dr and shift-ir states.
This is a deep talk for sure, but if you’re ever in the throes of building a microcontroller programmer or debugger, it provides a much-appreciated roadmap to doing so.
And once you’ve got your hardware setup, maybe it’s time to dig into GDB? We’ve got you covered.
from Blog – Hackaday https://ift.tt/s9teLgp
Comments
Post a Comment